
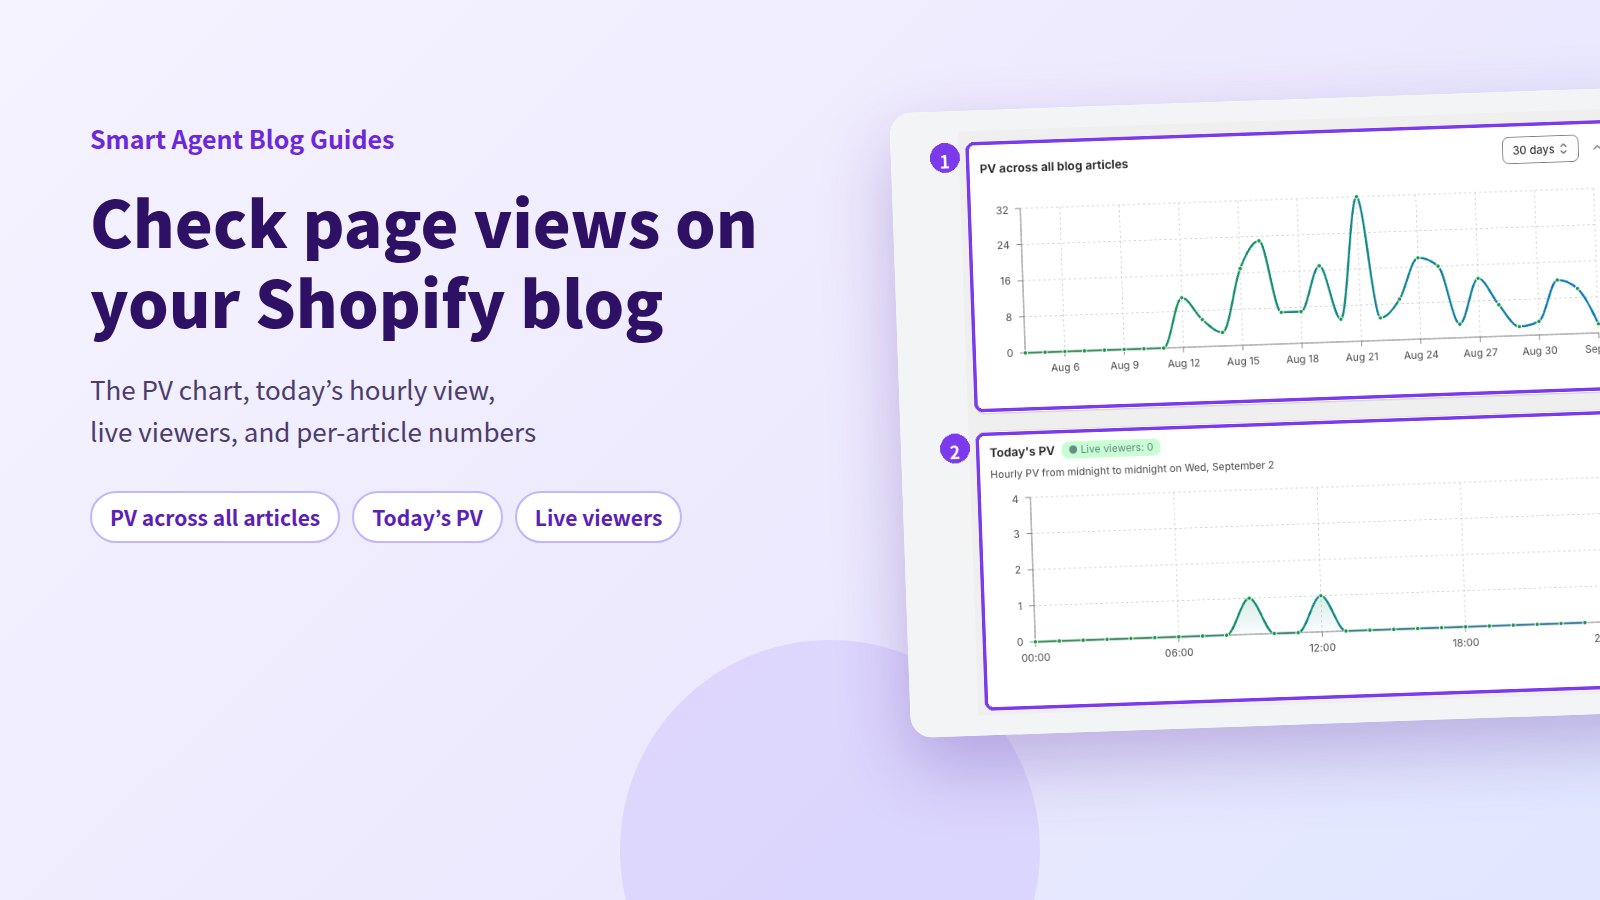
You publish a post and then have no idea whether anyone read it. That silence is where most store blogs quietly stop. Writing without feedback is hard for anyone.
The short version: Shopify's built-in analytics can already tell you whether blog posts are acting as entry points. Find the post URL in Sessions by landing page, and watch Live View for what's happening right now. That covers the basics.
It gets tedious once you want posts listed by title, sorted by views, with the quiet ones easy to spot. That's the part Smart Agent Blog puts on one screen. This guide walks through both.
- How to check blog traffic using Shopify's own analytics
- The four places page views appear in Smart Agent Blog
- How to read the PV chart, today's PV, and the live viewers badge
- How to sort posts by views and decide what to work on
- What to check when a published post stays at zero
No feedback, no blog
While preparing proposals for Smart Agent Blog in August and September 2026, we reviewed the blogs of 110 Shopify stores in Japan. About 4 in 10 (42 stores) had no posts, had stopped after a handful, or hadn't published in over a year.
The reasons vary, but the pattern is the same: nobody could see what publishing was adding up to. Watching a post slowly gather readers changes how it feels to keep going.
You don't need a sophisticated analytics practice. You need one screen, once a week.
Checking traffic in Shopify itself
Shopify ships with analytics, and blog posts are covered.
Find entry points with Sessions by landing page
Your Shopify admin's Analytics section includes a Sessions by landing page report showing where each visit started. Blog URLs (the ones containing /blogs/) appearing there are posts pulling people in.
- In your Shopify admin, open Analytics.
- Open Sessions by landing page from the reports.
- Choose a date range and look for URLs containing
/blogs/. - Compare the session counts against the previous period.
What's counted here is sessions — visits that began on that page. That is a different metric from page views, so the number won't line up exactly with other tools. That's expected, not a bug.
Watch the moment with Live View
Analytics > Live View shows visitors active on your online store in the past 5 minutes, along with orders, top pages, and locations. It's the right screen right after you post to social or send an email.
What the built-in reports do and don't give you
| What you want to know | Shopify Analytics |
|---|---|
| Are blog posts entry points? | Yes — Sessions by landing page |
| How many people are on the site now? | Yes — Live View, past 5 minutes |
| A list by post title | You match URLs to titles yourself |
| A blog-only trend line | You filter it out of store-wide reports |
| How far people read | Not covered |
In other words, the built-in reports are built for the whole store. Using them for blog work means matching URLs to titles every single time. With five posts that's fine. Past thirty, the habit breaks.
Removing that one chore is often all it takes to make a weekly check stick.
Four places page views appear in Smart Agent Blog
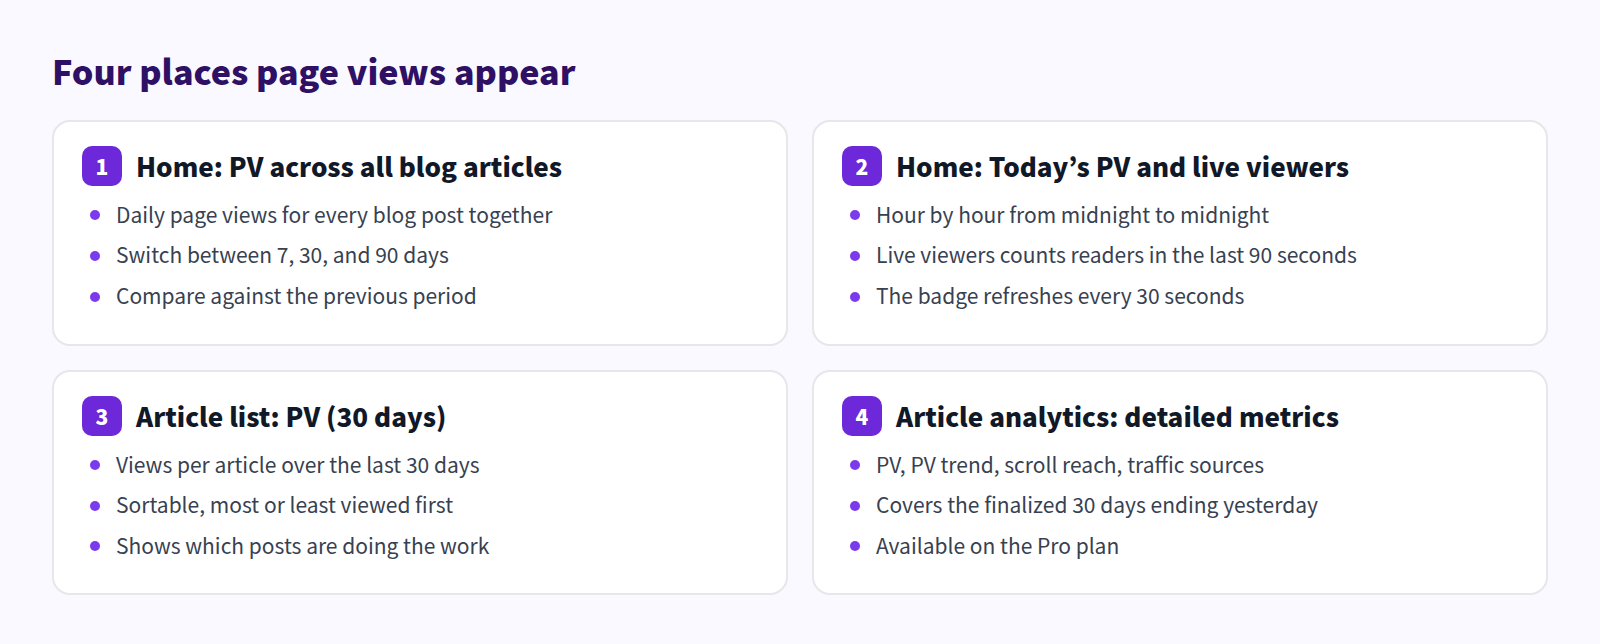
PV across all blog articles
The app home screen opens on a daily page-view chart covering every blog post together.
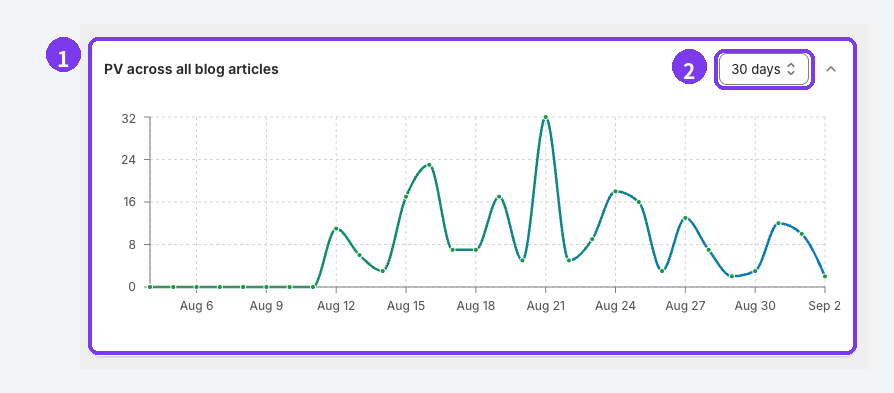
- PV across all blog articles — daily page views for the whole blog. Look for a bump the day after you publish.
- The range selector — 7, 30, or 90 days. The arrow beside it collapses the chart.
Newly published posts, and stores that only recently started measuring, may not have data yet.
Today's PV and live viewers
Underneath sit two views of the current day.
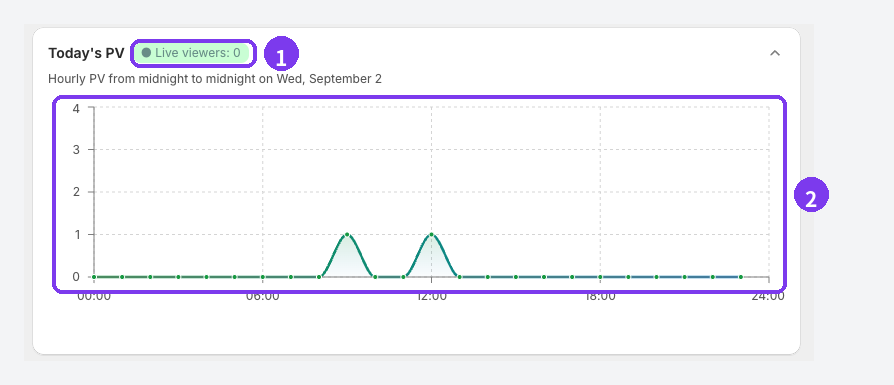
- Live viewers — people who were reading an article within the last 90 seconds, refreshed every 30 seconds. Zero is normal when nobody is reading, and it can take up to two minutes to fall back to zero after someone closes the page.
- Today's PV — page views hour by hour from midnight to midnight. Hours that haven't happened yet show as zero.
Live viewers is an approximation, affected by network conditions and when a reader closes the tab. Treat it as a sign of activity, not an exact count.
Page views per post
Which posts are doing the work is answered in the article list.

- PV (30 days) — views per article over the last 30 days, sortable most or least viewed first. Sorting by most viewed shows your current entry points immediately.
- View analytics — opens that article's analytics screen, available on the Pro plan or on a development store.
The Recent articles card on the home screen also shows page views, but a number only appears there when that article is also in Popular articles. Otherwise the row reads zero. For per-article figures, use PV (30 days) in the article list.
Popular articles lists up to five posts by views over the last 30 days, and omits posts with zero. The whole screen is documented in View the home screen.
Detailed metrics in article analytics
On Pro, each article gets a deeper set: PV, PV trend, scroll reach, traffic sources, and average active reading time. It covers the finalized 30 days ending yesterday — today is not included.
For what to look at after page views, see metrics beyond page views and where readers drop off.
How the two compare
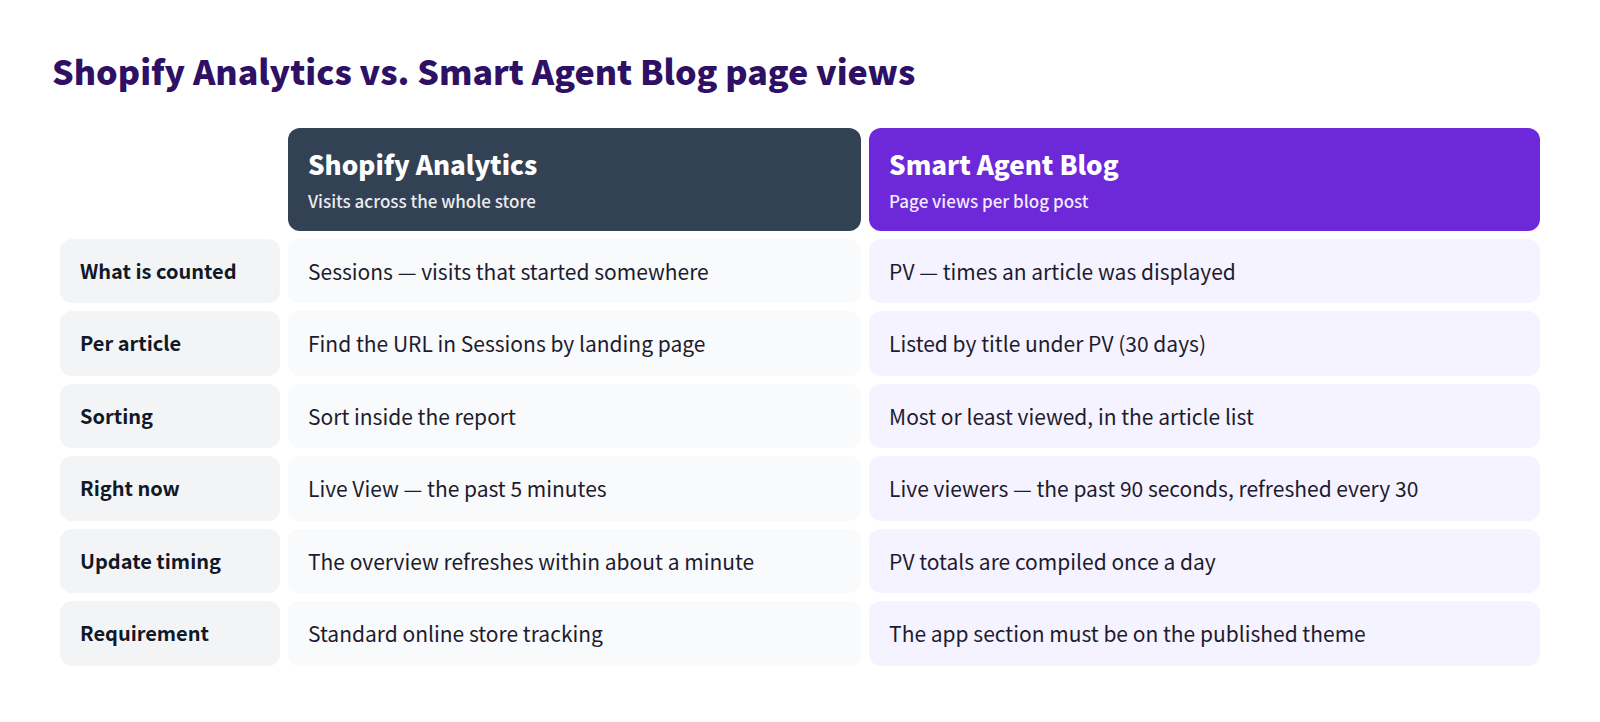
Neither is "correct." Tools differ in what they count, what they exclude, where the day boundary falls, and when they refresh. When comparing, line up the article, the period, the time zone, and the metric type first.
When a post stays at zero
Check these in order:
- The article is set to Visible.
- You can actually open it on the storefront.
- The published theme's blog post template contains the Smart Agent Blog section. Page views are measured by that section. Without it, nothing is recorded.
- It wasn't published minutes ago.
The third is by far the most common cause. Theme setup is covered in Display articles on your store, and compatibility in Shopify blog theme compatibility.
Page-view totals are compiled once a day, so today's reads won't appear in the article list today — and opening the post yourself a few times won't show up immediately either. Check again tomorrow. If it persists, see Analytics data is not displayed.
A weekly loop, in this order
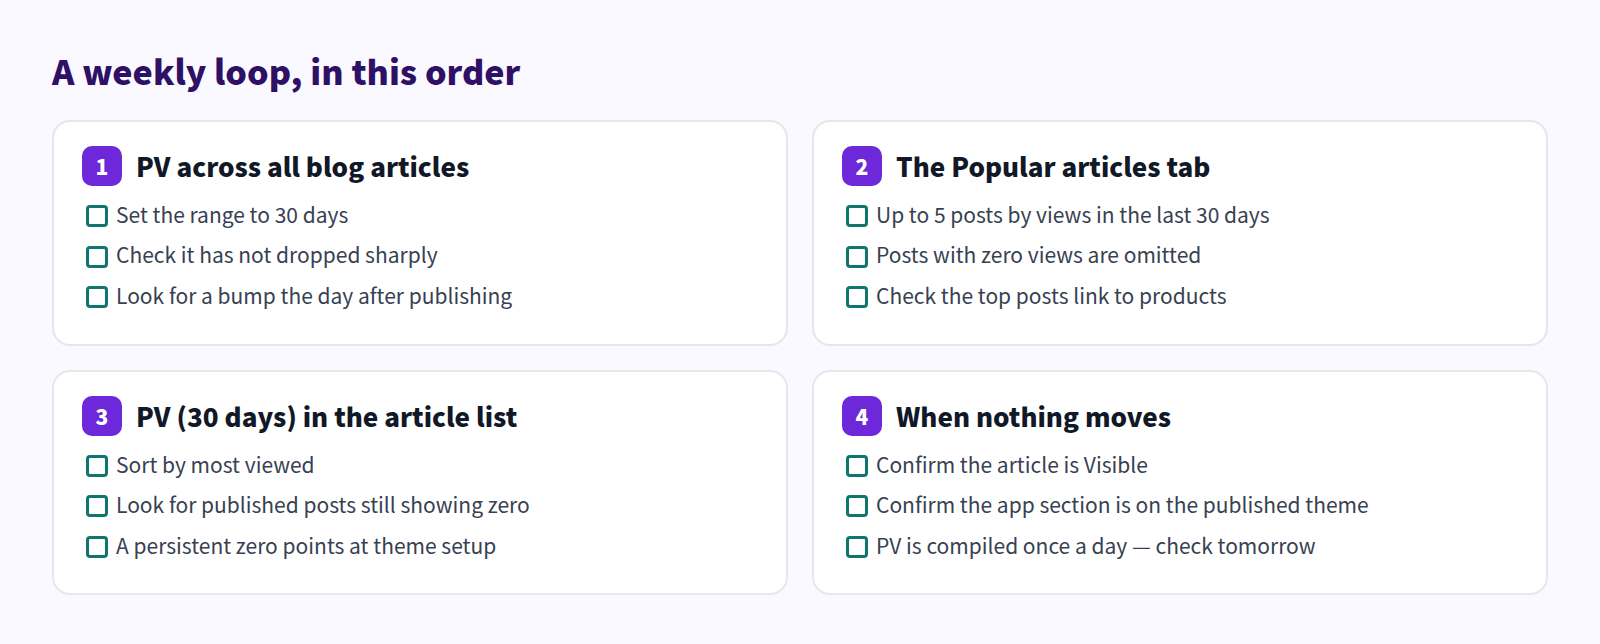
Five minutes. Once you can separate the posts being read from the ones that aren't, both your next topic and your next edit pick themselves. For the search side of the same loop, see the Shopify blog SEO report guide and the Shopify blog marketing guide.
Questions we get
What's the difference between page views and sessions?
A page view counts an article being displayed; a session counts a visit starting. One person reading two posts is two page views and one session. Neither is more correct — pick the one that answers your question.
Live viewers keeps showing zero
Zero is correct when nobody is reading. It counts views recorded in the last 90 seconds and refreshes every 30, so it takes up to two minutes to drop to zero after someone leaves.
The numbers are too small to judge anything
Don't judge right after publishing. Even the diagnostic scores wait until at least 50 measured views have accumulated. For working with thin data, see what to do while analytics is still collecting.
In short
- Shopify's own analytics already show blog entry points via Sessions by landing page, plus Live View for right now
- Its weakness is matching URLs back to post titles, every time
- Smart Agent Blog puts blog numbers in four places: the whole-blog PV chart, today's PV, live viewers, and PV (30 days) per article
- Totals compile once a day; a permanent zero usually means the app section is missing from the published theme
- Five minutes a week is enough to decide what to write and what to fix
Open the home screen and look at the last 30 days. That's the whole first step.